PODS for Finance
Know what you earn, what you are owed and what you owe.
P&L, cash flow, planning and tax in one place, so Finance can see profit, payouts and tax together and act on them.
P&L, cash flow, planning and tax in one place, so Finance can see profit, payouts and tax together and act on them.
Finance ends up joining reports by hand and explaining the gaps. PODS starts from the same orders your Ops team works with, so the answers come from one place.
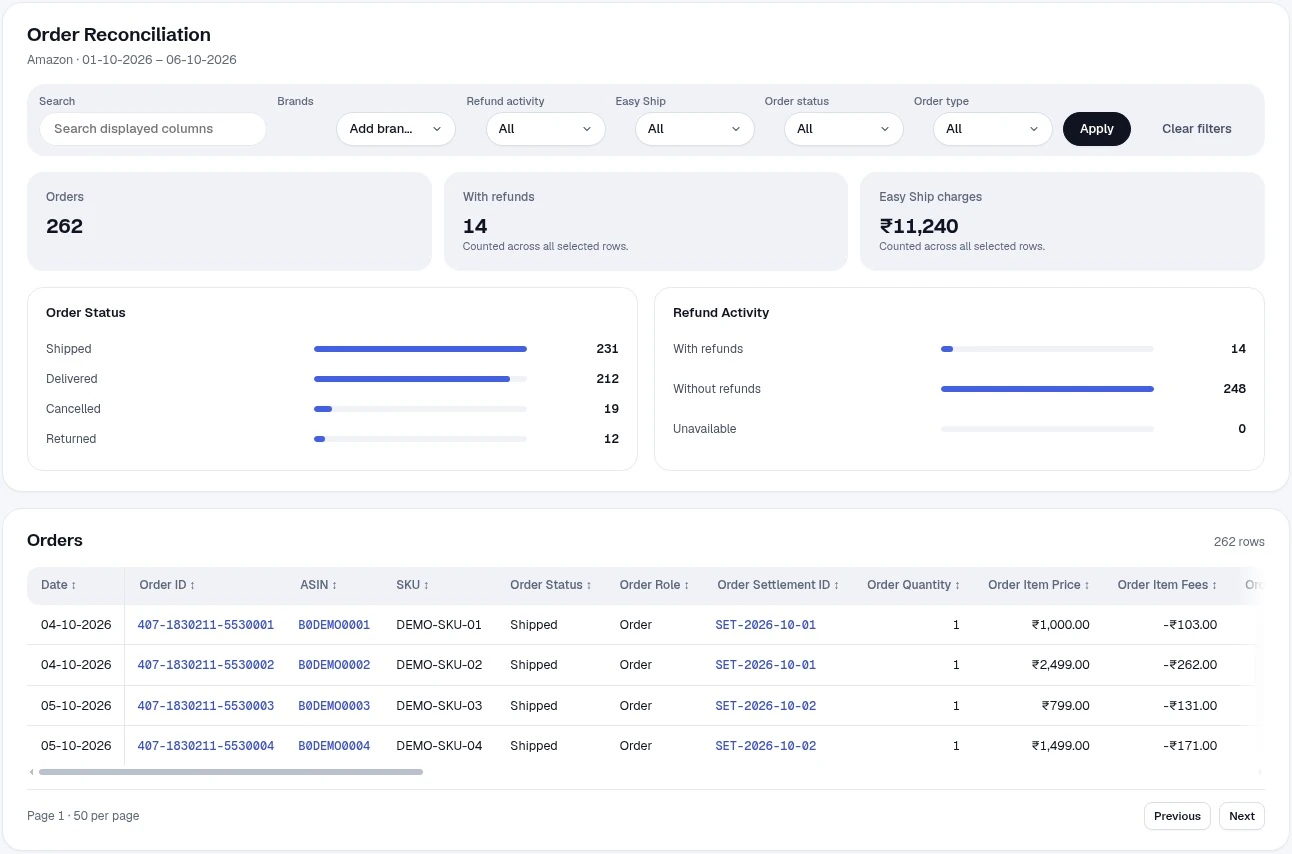
Fees, payments and products checked against what was expected, order by order.
What has settled, and what is still on its way, by channel and period.
GST by state, with the difference shown against Amazon’s documents.
Reconcile at order level, product level and payment level. Fee Reco compares the fees Amazon charged with the fees expected, so you can see whether you were charged correctly. Fee Reco lists overcharges and undercharges and shows a claimable figure. Reimbursement records sit on their own page.
Outcome: discrepancies you can see
One set of order data, from the first order to the last report.
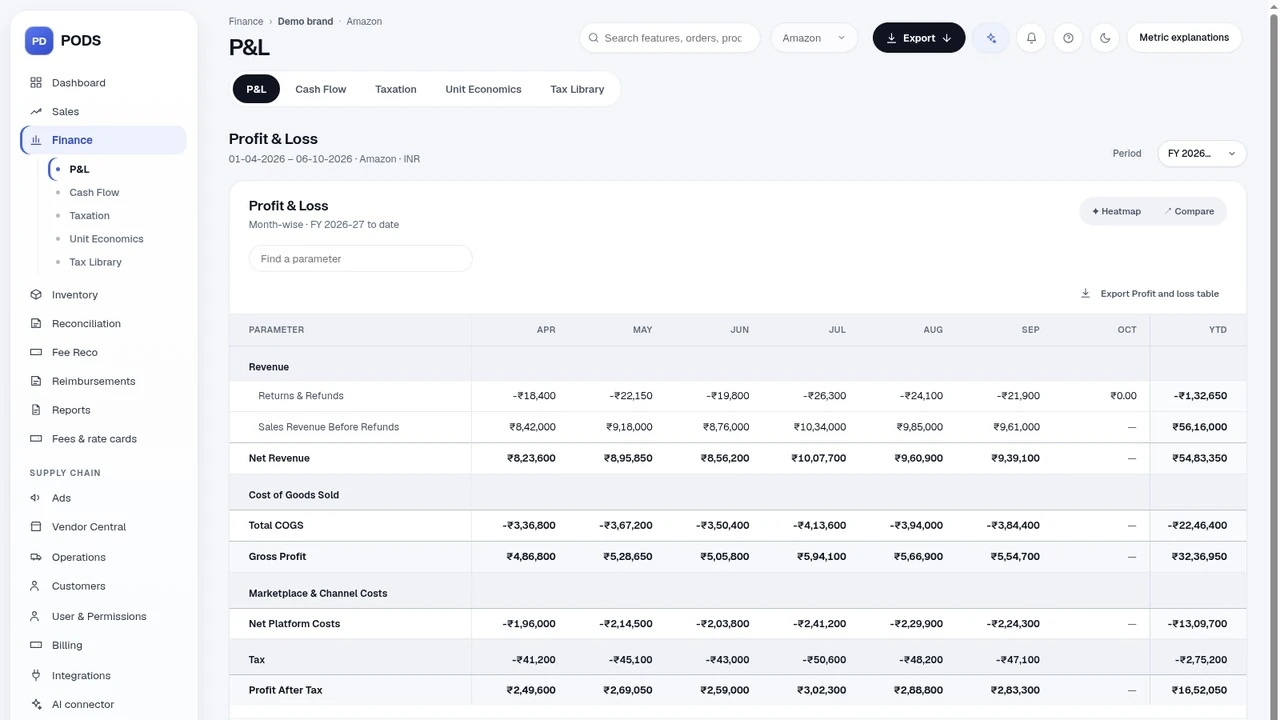
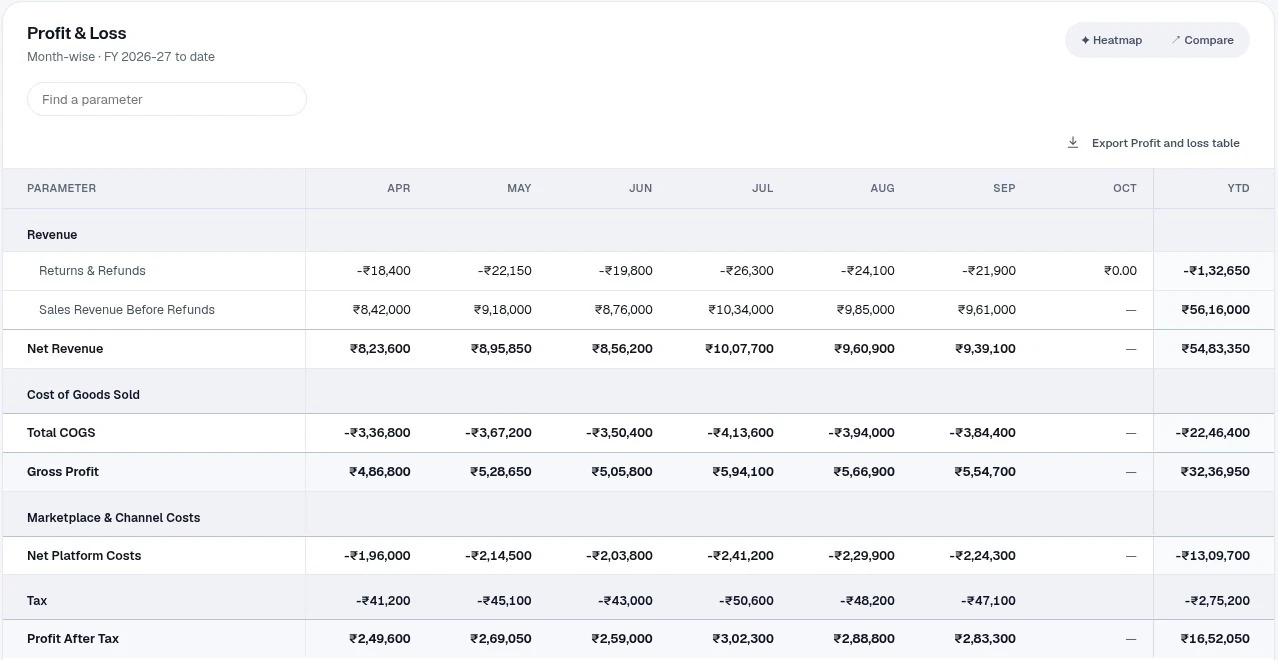
Revenue, returns, cost of goods, platform costs, tax and profit after tax, laid out by month. Switch to the heatmap or compare view to see what changed.
Outcome: profit with the lines behind it
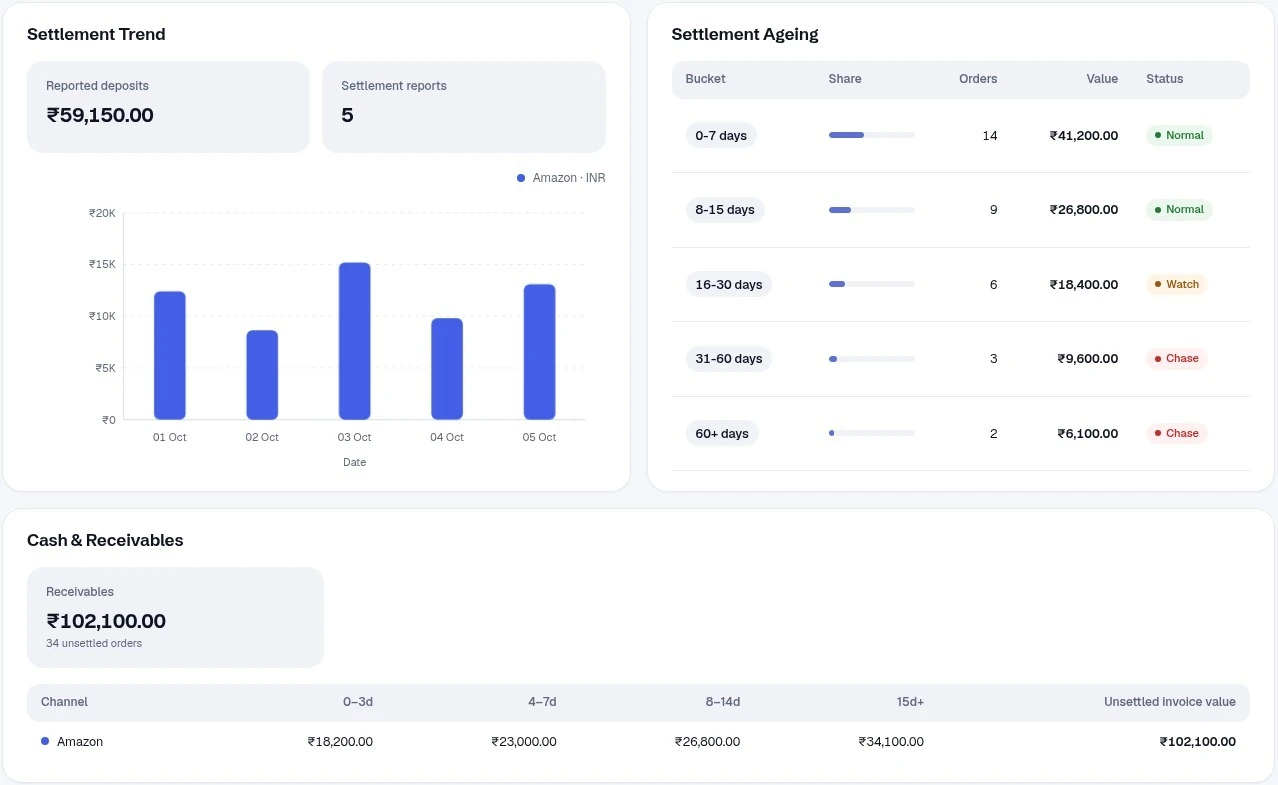
A complete picture of cash: settlements by channel and period, a register with order-wise status, and ageing for what is still waiting, so you can see the payments still to come and plan around them.
Outcome: a late payout is easy to spot
See GST state-wise, with refund reversals, TCS and TDS. Upload your Merchant Tax Report (MTR) and Tax Library puts Amazon’s documents beside PODS figures, with the difference shown.
Outcome: tax gaps show up as differences
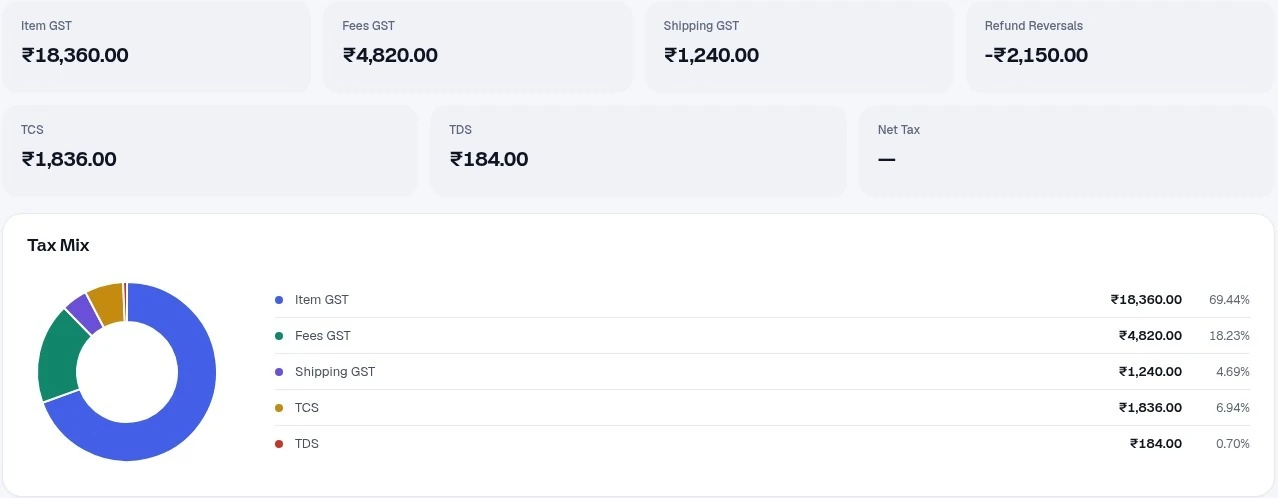
MTR is Amazon’s Merchant Tax Report, downloaded from the GST Monthly Report in Seller Central, in B2B and B2C versions.
Export tables and reports from PODS, ready to share with your CA, your team or your auditors.
Real PODS screens, sample figures added for this preview. Copy is provisional.
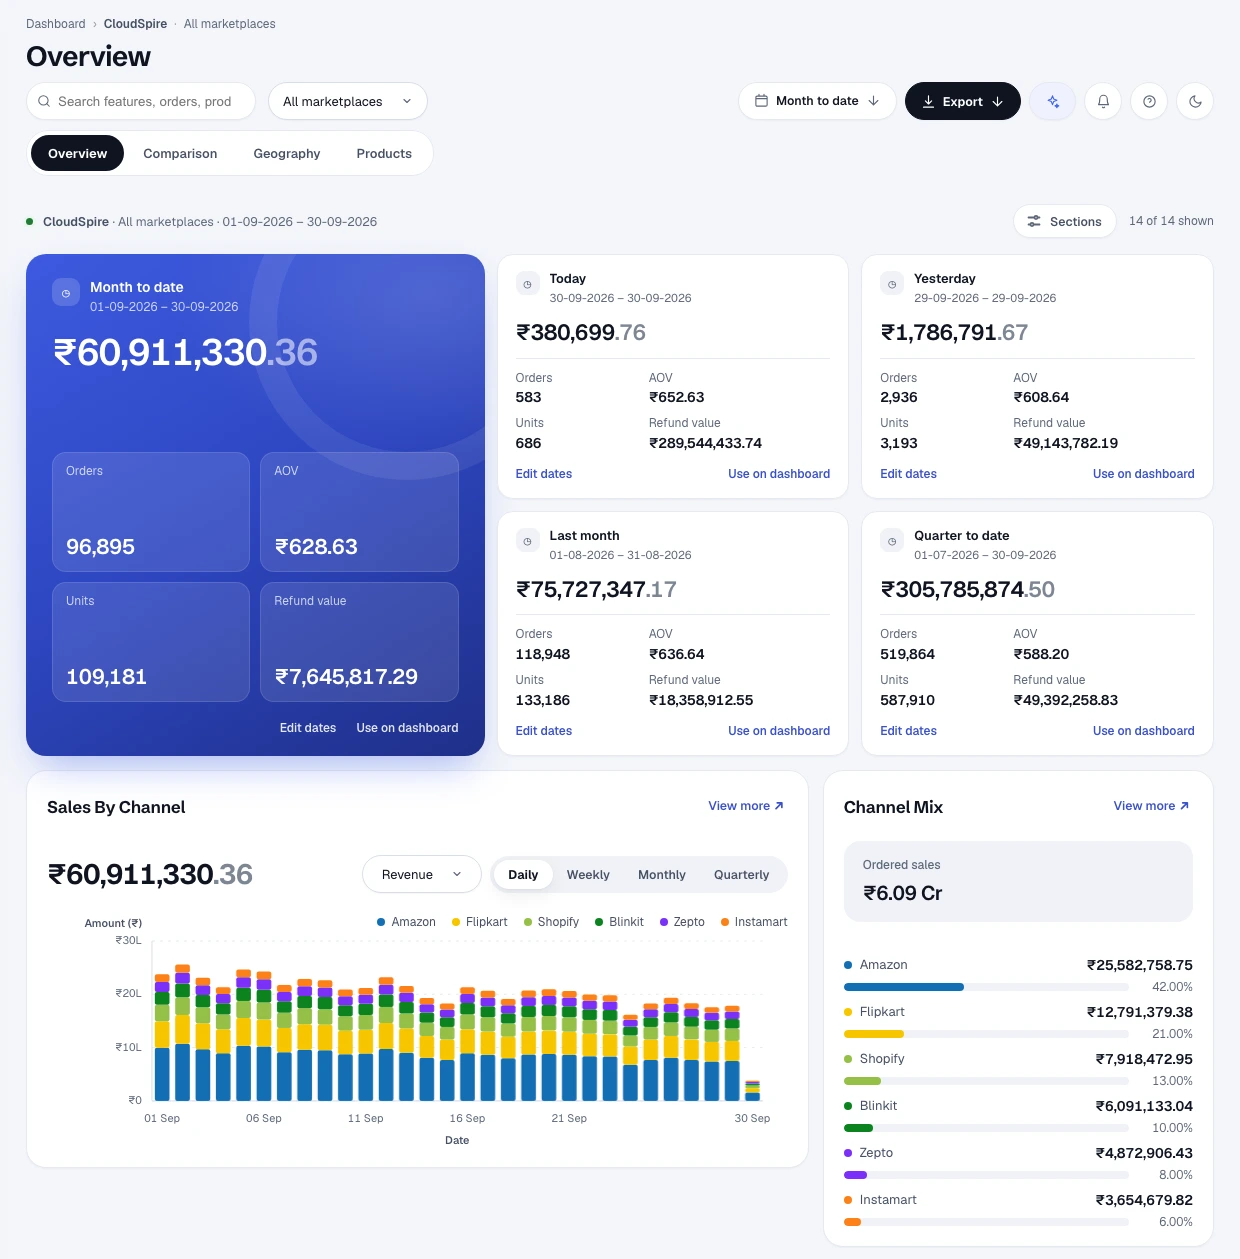
Bring your channel data into one workspace, so Finance works from one connected picture instead of one report at a time.









 QuickBooks
Connectors vary in how they connect. Ask sales which are available for your setup.
The P&L by month, with heatmap and compare views, and unit economics behind it.
Order, product and payment reconciliation, GST by state, and Amazon’s documents beside PODS figures.
A dashboard for the whole business, and a read-only AI connector for asking business questions of the same data.
Less time joining reports. A clearer view of profit, cash and tax, so decisions start from the same figures.
Fee checks, reimbursements and stock sit one click away from the figures Finance reads, so a question in one team can be answered from the other.
Talk to our sales team. Write to hi@positiveodds.in.